Performance Analyzer#
Performance Measurement#
This section covers measuring the latency of a model, achieving optimal performance on the target board, and the Zero-Copy feature.
You can use the NPU Runner application to measure the performance of a model by setting the VAISW_RUNSESSION_SUMMARY=all environment variable. This enables the collection of performance statistics when the application execution ends.
Here is an example of a performance summary table:
+-----------------------+--------+--------+--------+-------+
| Perf Summary          | ms/bch | ms/bch | ms/bch | smpl/s|
|                       | min    | max    | median | mdn   |
+-----------------------+--------+--------+--------+-------+
| Whole Graph total     |  8.24  |  8.69  |  8.25  | 121.15|
|   VART total (1 sg)   |  8.21  |  8.66  |  8.22  | 121.60|
|     AI acceleration * |  5.75  |  5.76  |  5.75  | 173.91|
|     CPU processing    |  2.46  |  2.90  |  2.47  |       |
|       In quantize     |  0.36  |  0.47  |  0.38  |       |
|       In reorder      |  1.23  |  1.55  |  1.23  |       |
|       In copy         |  0.08  |  0.20  |  0.08  |       |
|       Out copy        |  0.14  |  0.14  |  0.14  |       |
|       Out reorder     |  0.14  |  0.17  |  0.15  |       |
|       Out unquantize  |  0.13  |  0.14  |  0.14  |       |
|       Others          |        |        |  0.35  |       |
|   Others              |        |        |  0.02  |       |
+-----------------------+--------+--------+--------+-------+

[VART] min and max are measured individually, only the median sums are meaningful.
[VART] (*) AI Acceleration time includes the transfer to/from the external memories.

*******************************************************************
NOTE:
The column names in the table have been abbreviated or adjusted for better document rendering.
The original, full column names are provided in the following legend for reference.
The final output may use the original column names rather than the abbreviated ones shown here.
*******************************************************************

Legend:
   - ms/bch = milliseconds per batch
   - smpl/s = samples per second
   - mdn - Median
The performance summary consists of the following components:
Others: Refers to various operations distributed among the reported operations. This line is not included if the total is 0.
Input quantize: The duration the software stack on the APU requires to convert inputs from FLOAT to the precision of the layers on the AIE (INT or BF16).
Input reorder: The time taken by the software stack on the APU to arrange application inputs (typically 3 maps) into NPU DDR format inputs (four maps).
Input copy: The time required by the software stack on the APU to copy data between the user application memory space (cacheable area) and the physical memory space accessible by the NPU.
If the input is produced by software running on the ARM CPU, it might be necessary for improved performance to use a cacheable memory area for the CPU.
Since, in Vitis 2025.1, the physical memory space cannot be cacheable, a copy might be necessary.
Output copy: The time taken by the software stack on the APU to copy data between the physical memory space accessible by the NPU and the user application memory space. The same considerations as the Input copy apply.
Output reorder: The time needed by the software stack on the APU to reorganize data between the NPU format and the application format (NHWC or NCHW).
Output unquantize: The time the software stack on the APU takes to convert data from the NPU precision (INT8 or BF16) to FLOAT.
Measure the Performance#
You can measure a model’s performance using the NPU Runner C++ application (vart_ml_demo) or the Python application (vart_ml_runner.py).
Pre-Requisites
Ensure that the target board (VEK280) is up and running.
Copy required files, such as the snapshot of your model, sample test images/videos, label files, and ground truth files, to the target board’s
/rootdirectory.
Using the NPU Runner C++ Application#
The vart_ml_demo application is a test tool built on the VART C++ APIs, designed for the ResNet50 model. By default, input and output buffers are processed in NHWC format in packed mode (without padding) from application memory. During this operation, the NPU software stack transfers buffers to the NPU DDR and concurrently aligns the pixel format with the NPU DDR format, which is cycle-intensive and can impact performance.
Set the input or output tensor to the ‘native’ format recognized by the NPU software stack using the set_native_format API for optimal performance.
The vart_ml_demo application can be executed in different ways:
Execution1: Utilizes buffers in the application’s float data format. The software stack quantizes, converts data, and copies. For small networks like ResNet50, the execution bottleneck is the time taken to transfer input images to the FPGA.
Execution2: Employs buffers already in the INT format (pre-quantized). The software stack performs data conversion and copying only.
Execution3: Operates with buffers in the INT format and 32-bit data format, the NPU’s native format. This significantly reduces upload time, leaving only the transfer of input buffers from application memory to NPU memory.
Example commands for these execution options and their performance statistics are provided in the subsequent steps.
Run the NPU Runner C++ application on the VEK280 board by following these steps:
On the target board, navigate to
/rootwhere the snapshot is copied:$ cd /root
Source the Vitis AI tools environment:
$ source /etc/vai.sh
Export the following macro to compute performance statistics by the embedded software stack:
$ export VAISW_RUNSESSION_SUMMARY=all
Use the following commands for different executions of the vart_ml_demo application and measure the performance of the ResNet50 model.
Execution1:
$ vart_ml_demo --batchSize 19 --goldFile imagenet/ILSVRC_2012_val_GroundTruth_10p.txt --imgPath imagenet/ILSVRC2012_img_val --nbImages 190 --labels /etc/vai/labels/labels --snapshot /run/media/mmcblk0p1/snapshot.$NPU_IP.resnet50.TF
This command operates with an optimal batch size of 19 (for ResNet50 with input size 224x224 targeting the full 38 columns IP of VEK280) and conducts 10 inferences, each with 19 images, totaling 190 images processed. It outputs the performance details to the console, as illustrated in the following table.
Accuracy Summary:
[AMD] [resnet50 TEST top1] 68.42% passed.
[AMD] [resnet50 TEST top5] 80.53% passed.
[AMD] [resnet50 ALL TESTS] 68.42% passed.
[AMD] Running 1 models 966.72 imgs/s (190 images)
[VART]
[VART]           board VE2802 (AIE: 304 = 38x8)
[VART]           10 inferences of batch size 19 (the first inference is not used to compute the detailed times)
[VART]           1 input layer. Tensor shape: 19x224x224x3 (FLOAT32)
[VART]           1 output layer. Tensor shape: 19x1001 (INT8)
[VART]           1 total subgraph:
[VART]                   1 VART (AIE) subgraph
[VART]                   0 Framework (CPU) subgraph
[VART]           190 samples
[VART]
[VART] "resnet50" run summary:
[VART]           detailed times in ms
[VART] +--------------------------------+------------+------------+------------+------------+
[VART] | Performance Summary            |  ms/batch  |  ms/batch  |  ms/batch  |   sample/s |
[VART] |                                |    min     |    max     |   median   |   median   |
[VART] +--------------------------------+------------+------------+------------+------------+
[VART] | Whole Graph total              |      19.37 |      19.42 |      19.40 |     979.38 |
[VART] |   VART total (   1 sub-graph)  |      19.27 |      19.33 |      19.31 |     983.95 |
[VART] |     AI acceleration (*)        |       2.11 |       2.11 |       2.11 |    9013.28 |
[VART] |     CPU processing             |      17.16 |      17.22 |      17.20 |            |
[VART] |       Input quantize           |       0.20 |       0.23 |       0.20 |            |
[VART] |       Input reorder            |       0.79 |       0.83 |       0.79 |            |
[VART] |       Input copy (user->phys)  |      15.82 |      15.87 |      15.86 |            |
[VART] |       Output copy (phys->user) |       0.06 |       0.06 |       0.06 |            |
[VART] |       Others                   |            |            |       0.29 |            |
[VART] |   Others                       |            |            |       0.09 |            |
[VART] +--------------------------------+------------+------------+------------+------------+
[VART] (min and max are measured individually, only the median sums are meaningful).
[VART] (*) AI Acceleration time includes the transfer to/from the external memories.

*******************************************************************
NOTE:
The column names in the table have been abbreviated or adjusted for better document rendering.
The original, full column names are provided in the following legend for reference.
The final output may use the original column names rather than the abbreviated ones shown here.
********************************************************************

Legend:
- ms/b = milliseconds per batch
- smp/s = samples per second
- subg = subgraph
- AI accel = AI acceleration
- CPU proc = CPU processing
- In quant = Input quantize
- In reorder = Input reorder
- In cp (u->p) = Input copy (user->phys)
- Out cp (p->u) = Output copy (phys->user)
- Out unquant = Output unquantize
Note
The table provided serves illustrative purposes only and does not reflect the exact output. Actual tables may vary in appearance and data.
Execution2:
$ vart_ml_demo --batchSize 19 --goldFile imagenet/ILSVRC_2012_val_GroundTruth_10p.txt --imgPath imagenet/ILSVRC2012_img_val --nbImages 190 --labels /etc/vai/labels/labels --snapshot /run/media/mmcblk0p1/snapshot.$NPU_IP.resnet50.TF --useExternalQuant 64
This command displays the performance details to the console, as shown in the following table.
Accuracy Summary:
[AMD] [resnet50 TEST top1] 68.42% passed.
[AMD] [resnet50 TEST top5] 80.53% passed.
[AMD] [resnet50 ALL TESTS] 68.42% passed.
[AMD] Running 1 models 1248.86 imgs/s (190 images)
[VART]
[VART]           board VE2802 (AIE: 304 = 38x8)
[VART]           10 inferences of batch size 19 (the first inference is not used to compute the detailed times)
[VART]           1 input layer. Tensor shape: 19x224x224x3 (FLOAT32)
[VART]           1 output layer. Tensor shape: 19x1001 (INT8)
[VART]           1 total subgraph:
[VART]                   1 VART (AIE) subgraph
[VART]                   0 Framework (CPU) subgraph
[VART]           190 samples
[VART]
[VART] "resnet50" run summary:
[VART]           detailed times in ms
[VART] +--------------------------------+------------+------------+------------+------------+
[VART] | Performance Summary            |  ms/batch  |  ms/batch  |  ms/batch  |   sample/s |
[VART] |                                |    min     |    max     |   median   |   median   |
[VART] +--------------------------------+------------+------------+------------+------------+
[VART] | Whole Graph total              |      14.94 |      15.04 |      14.96 |    1269.80 |
[VART] |   VART total (   1 sub-graph)  |      14.85 |      14.95 |      14.88 |    1277.14 |
[VART] |     AI acceleration (*)        |       2.11 |       2.11 |       2.11 |    9009.01 |
[VART] |     CPU processing             |      12.74 |      12.84 |      12.77 |            |
[VART] |       Input reorder            |      11.18 |      11.26 |      11.19 |            |
[VART] |       Input copy (user->phys)  |       1.04 |       1.07 |       1.06 |            |
[VART] |       Output copy (phys->user) |       0.06 |       0.06 |       0.06 |            |
[VART] |       Others                   |            |            |       0.46 |            |
[VART] |   Others                       |            |            |       0.09 |            |
[VART] +--------------------------------+------------+------------+------------+------------+
[VART] (min and max are measured individually, only the median sums are meaningful).
[VART] (*) AI Acceleration time includes the transfer to/from the external memories.

*******************************************************************
NOTE:
The column names in the table have been abbreviated or adjusted for better document rendering.
The original, full column names are provided in the following legend for reference.
The final output may use the original column names rather than the abbreviated ones shown here.
********************************************************************

Legend:
- ms/b = milliseconds per batch
- smp/s = samples per second
- subg = subgraph
- AI accel = AI acceleration
- CPU proc = CPU processing
- In reorder = Input reorder
- In cp (u->p) = Input copy (user->phys)
Note
The table shown is for illustrative purposes only and does not reflect exact output. Actual tables might differ in appearance and data.
This execution uses buffers of the INT data type, meaning quantized data is provided as input. Thus, Quantize and Unquantize are not reported in the performance table.
Execution3:
$ vart_ml_demo --batchSize 19 --goldFile imagenet/ILSVRC_2012_val_GroundTruth_10p.txt --imgPath imagenet/ILSVRC2012_img_val --nbImages 190 --labels /etc/vai/labels/labels --snapshot /run/media/mmcblk0p1/snapshot.$NPU_IP.resnet50.TF --useExternalQuant 64 --dataFormat native
This command outputs the performance details to the console, as depicted in the following table.
Accuracy Summary:
[AMD] [resnet50 TEST top1] 68.42% passed.
[AMD] [resnet50 TEST top5] 80.53% passed.
[AMD] [resnet50 ALL TESTS] 68.42% passed.
[AMD] VART ML runner data format was set to NATIVE.
[AMD] Running 1 models 7022.80 imgs/s (190 images)
[VART]
[VART]           board VE2802 (AIE: 304 = 38x8)
[VART]           10 inferences of batch size 19 (the first inference is not used to compute the detailed times)
[VART]           1 input layer. Tensor shape: 19x224x224x3 (FLOAT32)
[VART]           1 output layer. Tensor shape: 19x1001 (INT8)
[VART]           1 total subgraph:
[VART]                   1 VART (AIE) subgraph
[VART]                   0 Framework (CPU) subgraph
[VART]           190 samples
[VART]
[VART] "resnet50" run summary:
[VART]           detailed times in ms
[VART] +--------------------------------+------------+------------+------------+------------+
[VART] | Performance Summary            |  ms/batch  |  ms/batch  |  ms/batch  |   sample/s |
[VART] |                                |    min     |    max     |   median   |   median   |
[VART] +--------------------------------+------------+------------+------------+------------+
[VART] | Whole Graph total              |       2.64 |       2.66 |       2.65 |    7180.65 |
[VART] |   VART total (   1 sub-graph)  |       2.58 |       2.59 |       2.58 |    7358.64 |
[VART] |     AI acceleration (*)        |       2.11 |       2.11 |       2.11 |    9000.47 |
[VART] |     CPU processing             |       0.47 |       0.48 |       0.47 |            |
[VART] |       Others                   |            |            |       0.47 |            |
[VART] |   Others                       |            |            |       0.06 |            |
[VART] +--------------------------------+------------+------------+------------+------------+
[VART] (min and max are measured individually, only the median sums are meaningful).
[VART] (*) AI Acceleration time includes the transfer to/from the external memories.

*******************************************************************
NOTE:
The column names in the table have been abbreviated or adjusted for better document rendering.
The original, full column names are provided in the following legend for reference.
The final output may use the original column names rather than the abbreviated ones shown here.
*******************************************************************


Legend:
- ms/b = milliseconds per batch
- smp/s = samples per second
- subg = subgraph
- AI accel = AI acceleration
- CPU proc = CPU processing
The performance summary table does not display upload/download times because the zero-copy feature is enabled.
Note
The table provided is for illustrative purposes only and does not represent the exact output. Actual tables may vary in appearance and content.
In this execution, the
--dataFormat nativeoption is used, meaning buffers are in INT format and 32-bit data format (the NPU’s native format). Consequently, the upload time is significantly reduced, as shown in the performance table.
Enabling profiling (VAISW_RUNSESSION_SUMMARY=all) slightly diminishes performance at the application level. Disable profiling using the VAISW_RUNSESSION_SUMMARY=none option to enhance performance.
To disable profiling:
$ VAISW_RUNSESSION_SUMMARY=none vart_ml_demo --batchSize 19 --goldFile imagenet/ILSVRC_2012_val_GroundTruth_10p.txt --imgPath imagenet/ILSVRC2012_img_val --nbImages 190 --labels /etc/vai/labels/labels --snapshot /run/media/mmcblk0p1/snapshot.$NPU_IP.resnet50.TF --useExternalQuant 64 --dataFormat native --repeat 10
This command outputs the FPS observed at the application level as follows:
[AMD] Running 1 models 7329.32 imgs/s (1900 images)
Note
The result provided is for illustrative purposes only and does not reflect the exact output. Actual results may vary in appearance and content.
According to these results, and compared to the output from Execution3, performance improves when the profiling option is disabled.
Note
The vart_ml_demo application only supports the ResNet50 model, as pre-processing and post-processing are specifically implemented for it. To run a custom model, customize the vart_ml_demo application with the necessary pre- and post-processing implementations. For instructions on building the vart_ml_demo application after customization, refer to the Recompile NPU section.
Using the NPU Runner Python Application#
The vart_ml_runner.py Python application is a general tool designed for testing. Its primary function is to quickly execute a snapshot model on the VEK board, allowing profiling of execution time and verification of bit accuracy. However, this application does not offer options for using native input or output, nor does it allow control over the input or output shape.
Follow these steps to run the NPU Runner Python application on the VEK280 board:
On the target board, navigate to
/rootwhere the snapshot is located:$ cd /root
Source the Vitis AI tools environment:
$ source /etc/vai.sh
Export the following macro to compute performance statistics by the embedded software stack:
$ export VAISW_RUNSESSION_SUMMARY=all
Run the NPU Runner Python application with the ResNet50 model:
$ vart_ml_runner.py --snapshot /run/media/mmcblk0p1/snapshot.$NPU_IP.resnet50.TF
This command outputs the performance details to the console, as depicted in the following table.
[VART]
[VART]           board VE2802 (AIE: 304 = 38x8)
[VART]           10 inferences of batch size 19 (the first inference is not used to compute the detailed times)
[VART]           1 input layer. Tensor shape: 19x224x224x3 (FLOAT32)
[VART]           1 output layer. Tensor shape: 19x1001 (FLOAT32)
[VART]           2 total subgraphs:
[VART]                   1 VART (AIE) subgraph
[VART]                   1 Framework (CPU) subgraph
[VART]           190 samples
[VART]
[VART] "resnet50" run summary:
[VART]           detailed times in ms
[VART] +--------------------------------+------------+------------+------------+------------+
[VART] | Performance Summary            |  ms/batch  |  ms/batch  |  ms/batch  |   sample/s |
[VART] |                                |    min     |    max     |   median   |   median   |
[VART] +--------------------------------+------------+------------+------------+------------+
[VART] | Whole Graph total              |      21.78 |      22.08 |      21.90 |     867.66 |
[VART] |   VART total (   1 sub-graph)  |      21.39 |      21.69 |      21.51 |     883.27 |
[VART] |     AI acceleration (*)        |       2.11 |       2.11 |       2.11 |    9004.74 |
[VART] |     CPU processing             |      19.28 |      19.58 |      19.40 |            |
[VART] |       Input quantize           |       0.20 |       0.20 |       0.20 |            |
[VART] |       Input reorder            |       0.90 |       0.92 |       0.90 |            |
[VART] |       Input copy (user->phys)  |      17.80 |      18.12 |      17.88 |            |
[VART] |       Output copy (phys->user) |       0.06 |       0.07 |       0.06 |            |
[VART] |       Others                   |            |            |       0.36 |            |
[VART] |   OnnxRT CPU (   1 sub-graph)  |       0.25 |       0.28 |       0.26 |            |
[VART] |   Others                       |            |            |       0.13 |            |
[VART] +--------------------------------+------------+------------+------------+------------+
[VART] (min and max are measured individually, only the median sums are meaningful).
[VART] (*) AI Acceleration time includes the transfer to/from the external memories.

*******************************************************************
NOTE:
The column names in the table have been abbreviated or adjusted for better document rendering.
The original, full column names are provided in the following legend for reference.
The final output may use the original column names rather than the abbreviated ones shown here.
********************************************************************

Legend:
- ms/b = milliseconds per batch
- smp/s = samples per second
- subg = subgraph
- AI accel = AI acceleration
- CPU proc = CPU processing
- In quant = Input quantize
- In reorder = Input reorder
- In cp (u->p) = Input copy (user->phys)
- Out cp (p->u) = Output copy (phys->user)
- Out unquant = Output unquantize
Run the NPU Runner Python application with the ResNet50 model, with –in_native option to avoid quantize and input reorder times in performance summary table:
$ vart_ml_runner.py --snapshot /run/media/mmcblk0p1/snapshot.$NPU_IP.resnet50.TF --in_native
This command outputs the performance details to the console, as depicted in the following table.
[VART]
[VART]           board VE2802 (AIE: 304 = 38x8)
[VART]           10 inferences of batch size 19 (the first inference is not used to compute the detailed times)
[VART]           1 input layer. Tensor shape: 19x224x224x3 (FLOAT32)
[VART]           1 output layer. Tensor shape: 19x1001 (FLOAT32)
[VART]           2 total subgraphs:
[VART]                   1 VART (AIE) subgraph
[VART]                   1 Framework (CPU) subgraph
[VART]           190 samples
[VART]
[VART] "resnet50" run summary:
[VART]           detailed times in ms
[VART] +--------------------------------+------------+------------+------------+------------+
[VART] | Performance Summary            |  ms/batch  |  ms/batch  |  ms/batch  |   sample/s |
[VART] |                                |    min     |    max     |   median   |   median   |
[VART] +--------------------------------+------------+------------+------------+------------+
[VART] | Whole Graph total              |       4.20 |       4.36 |       4.22 |    4501.30 |
[VART] |   VART total (   1 sub-graph)  |       3.73 |       3.90 |       3.76 |    5050.50 |
[VART] |     AI acceleration (*)        |       2.11 |       2.11 |       2.11 |    9000.47 |
[VART] |     CPU processing             |       1.62 |       1.79 |       1.65 |            |
[VART] |       Input copy (user->phys)  |       1.04 |       1.14 |       1.05 |            |
[VART] |       Output copy (phys->user) |       0.06 |       0.07 |       0.06 |            |
[VART] |       Others                   |            |            |       0.54 |            |
[VART] |   OnnxRT CPU (   1 sub-graph)  |       0.26 |       0.29 |       0.27 |            |
[VART] |   Others                       |            |            |       0.19 |            |
[VART] +--------------------------------+------------+------------+------------+------------+
[VART] (min and max are measured individually, only the median sums are meaningful).
[VART] (*) AI Acceleration time includes the transfer to/from the external memories.

*******************************************************************
NOTE:
The column names in the table have been abbreviated or adjusted for better document rendering.
The original, full column names are provided in the following legend for reference.
The final output may use the original column names rather than the abbreviated ones shown here.
*******************************************************************

Legend:
- ms/b = milliseconds per batch
- smp/s = samples per second
- subg = subgraph
- AI accel = AI acceleration
- CPU proc = CPU processing
- In cp (u->p) = Input copy (user->phys)
- Out cp (p->u) = Output copy (phys->user)
- Out unquant = Output unquantize
The vart_ml_runner.py application is a test tool that can also be utilized to run custom models. However, it does not use the same application arguments as the vart_ml_demo application.
Options For Performance Optimization#
Two new algorithms were implemented for the 2025.1 release:
Placement algorithm: This optimizes the use of AIE columns. Setting this option is necessary only during snapshot generation (no setting needed during embedded execution):
$ export VAISW_DEVICEMAPPER_FORCECLUSTERALGORITHM=local_searchThe following option will improve the performance for models having NHWC output (typically a Yolo), but this option will have no impact on classification models (ResNet50). And, this optimization has very rare failures on corner case output shape, and hasn’t been enabled by default, but is likely to work on regular models.
$ export VAISW_RUNOPTIMIZATION_ENABLEBETTERGMIOFORNHWCFORMAT=true
Note
These algorithms are experimental and may fail either during snapshot generation or during board execution.
Zero-Copy Feature#
This section discusses the zero-copy feature and its implications for buffer allocation strategies.
Without the zero-copy feature, the application allocates buffers using either xrt::bo or malloc options. With xrt::bo, the application can obtain both physical and virtual pointers, allocate buffers using contiguous memory in DDR, and select the DDR ID during buffer allocation. With malloc, the application gets a virtual pointer and a non-contiguous memory buffer in DDR, with no option for DDR ID selection. The VART API accepts buffer pointers as virtual pointers to buffer memory, and the VART software stack always performs a memcopy from the virtual buffers (user buffers) to the NPU buffers in physical memory.
The zero-copy feature allows the NPU IP to dynamically change the addresses of input and output buffers between successive inferences. To leverage this feature, the memory format of the data must be compatible with the NPU’s native format. If the buffer’s memory format is not natively supported by the NPU, a format conversion must be performed using software, thus negating the benefits of zero-copy. For optimal performance, applications should handle buffers compatible with the native format of the NPU IP. The application can either set the native format on the tensor to indicate that the buffer is in native format and zero-copy can be used, or ensure the buffer is already in a memory format compatible with the NPU. Examples of memory formats compatible with the NPU IP include 2D buffers (output of classification networks) and 4-channel input interleaved in packed format (RGBX).
With the zero-copy feature, buffers can be allocated by the application using xrt::bo and malloc_buffer options. Here’s a brief overview of each:
xrt::bo:
Provides both physical and virtual pointers.
Allocates buffer using contiguous memory in DDR.
Allows selection of DDR ID during buffer allocation.
malloc_buffer:
Introduces malloc_buffer, free_buffer, and get_physical_addr functions.
malloc_buffer takes arguments of a DDR ID and a size to allocate, returning a virtual address for the buffer allocated in the specified DDR.
get_buffer returns a virtual pointer that can be passed to execute_async as any virtual pointer and will automatically be used for zero-copy if the set_native format is set or if the memory format is compatible with the NPU native format.
The VART API execute_async accepts:
Virtual pointers allocated using malloc, where the NPU SW stack performs a copy from virtual address to physical address.
Virtual addresses allocated using malloc_buffer, enabling zero-copy if the buffer format is compatible with the NPU format.
Physical addresses, where the NPU SW stack uses the buffers directly without performing any memory copy or data conversion.
Regarding DDR allocations:
NPU can handle buffers from any DDR memory.
It is supported to have all buffers (input + output) on the same DDR memory.
However, for better performance, it is recommended to balance the buffers across all DDR memories.
Refer to VART ML APIs section for the syntax and descriptions of the VART APIs.
AI Analyzer#
From Vitis AI 6.1, option VAISW_DEBUG_DUMPDEVICEGRAPH=FULL can be used during snapshot generation.
It enables the creation of a directory named analyzer_dump and of two files:
a json file named <network_name>_<deviceMapper_ClusterAlgorithm>.details.json
a csv file named <network_name>_<deviceMapper_ClusterAlgorithm>_analysis_dump.csv
The location of these elements can be controlled by setting the following config to the desired path: VAISW_DEBUG_DUMPDEVICEGRAPHDIRECTORY=<path>.
Example#
This section explains how to generate AI analyzer dump for ResNet50 model and analyze it.
Run the docker and generate snapshot for ResNet50 with AI analyzer dump option..
$ cd <path_to_Vitis-AI_source>/Vitis-AI
$ source npu_ip/settings.sh
$ ./docker/run.bash
$ source npu_ip/settings.sh
$ cd examples/python_examples/batcher
# Sample command to compile your model with VAISW_DEBUG_DUMPDEVICEGRAPHDIRECTORY and VAISW_DEBUG_DUMPDEVICEGRAPH options to generate AI analyzer dump.
# VAISW_DEBUG_DUMPDEVICEGRAPHDIRECTORY=$VITIS_AI_REPO/ai_analyzer_dump_your_model_name/ VAISW_DEBUG_DUMPDEVICEGRAPH=FULL VAISW_SNAPSHOT_DIRECTORY=snapshot.your_model_name ./your_model_compile_script
$ VAISW_DEBUG_DUMPDEVICEGRAPHDIRECTORY=$VITIS_AI_REPO/ai_analyzer_dump_ResNet50/ VAISW_DEBUG_DUMPDEVICEGRAPH=FULL VAISW_SNAPSHOT_DIRECTORY=snapshot.resnet50.tf2.b19 ./run_classification.sh -f tensorflow2 -n resnet50 -b 19
The above command generates the snapshot snapshot.resnet50.tf2.b19 and AI analyzer dump at $VITIS_AI_REPO/ai_analyzer_dump_ResNet50/ path.
Run AI Analyzer tool to get the HTTP URL page which can be used to visualize the AI analyzer dump.
# Go to $VITIS_AI_REPO path where you can launch AI analyzer command to load AI analyzer dumps
$ cd $VITIS_AI_REPO
# Example command
# bin/aianalyzer analyzer_dump_dir --port PORT_NUMBER --no-browser --bind 0.0.0.0
$ bin/aianalyzer ai_analyzer_dump_ResNet50/ --port 8011 --no-browser --bind 0.0.0.0
It will show the address that can be accessed from host machine, for example:
2026-**-** 14:30:59,629 INFO [client_id=n/a] 129198630880960 server.py:35 AI Analyzer 1.7.0.dev20260130181427+g301504b8 serving on http://0.0.0.0:8011/dashboard?token=V7zgkVRMcpUqLDGjCUYEoafALCoB61GHFCUBM2GhDk
Then start a browser from host machine, and access the above address from the browser: http://0.0.0.0:8011/dashboard?token=7ur2Mdo9TkLJxTXbYKyRuLXahGsG5EobmWlfB4EN56U
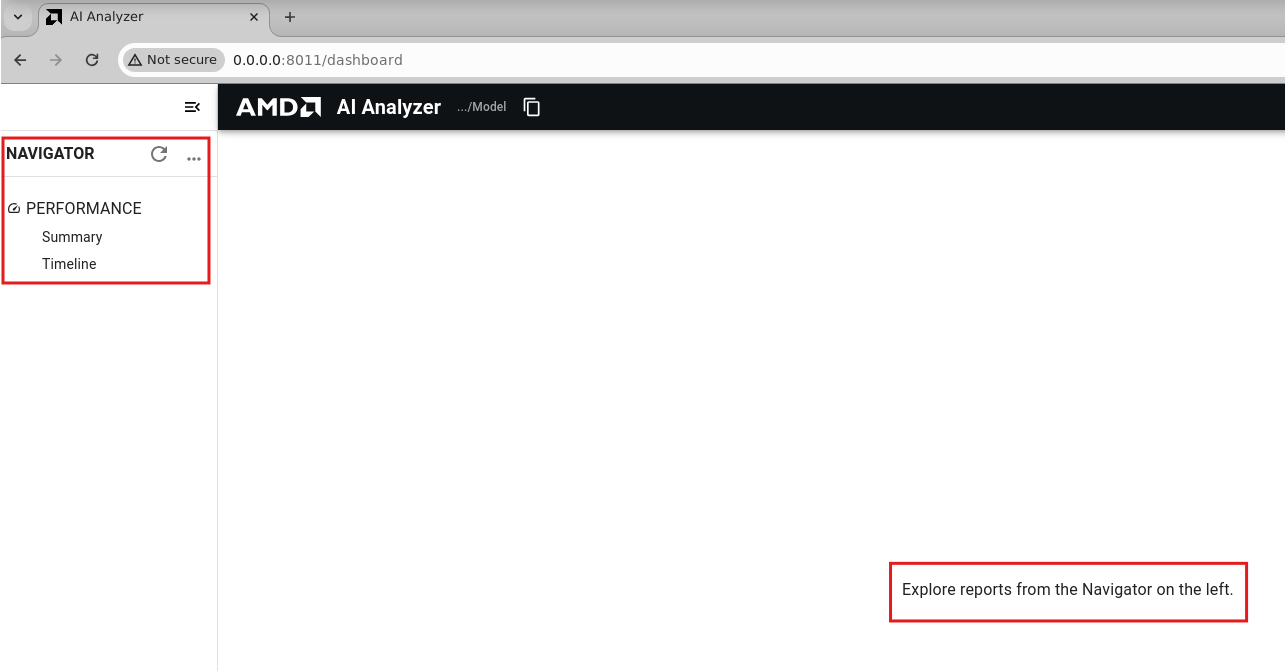
When launched, the AI Analyzer scans the folder specified with the analyzer_dump_dir argument and detects and loads all files relevant to compilation.
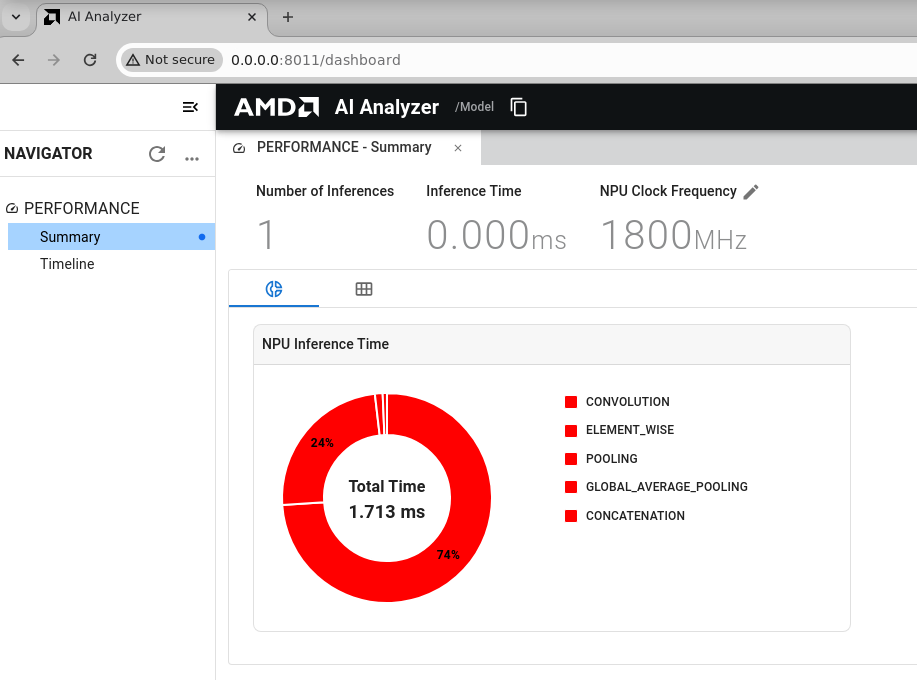
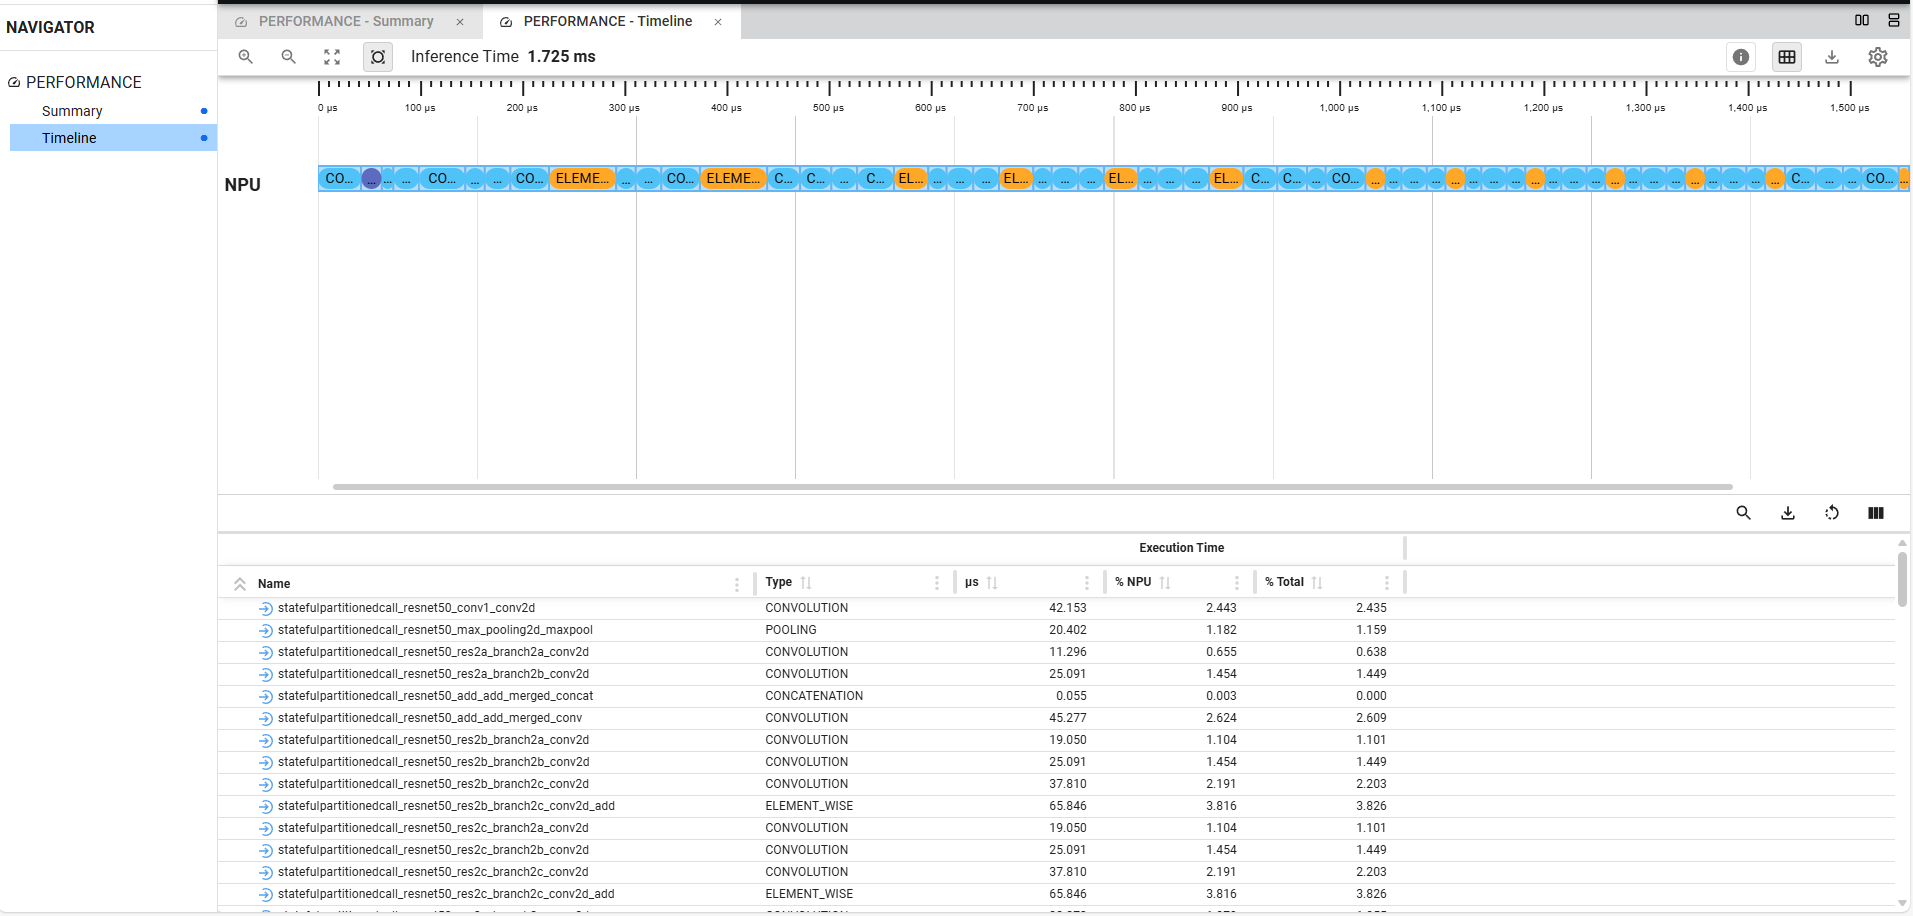
Refer following figures which showcase navigator, performance summary and timelines.
Navigator:
Performance Summary:
Performance Timelines:
Note
The URL may be different in your case.
The AI Analyzer tool is an early version. The reported clock frequency and inference time are based on simulation results and do not represent actual runtime performance on the target hardware. These values should be considered indicative only. An enhanced version of the tool will be available in the next release.