Troubleshooting Support#
Q1. Is it possible to compare outputs of the offline simulation with those from the target board?#
Ans: Yes, the following steps describe how you verify that the on-board execution matches the expected results.
Compilation Step (On Host Machine)
Set the VAISW_SNAPSHOT_DUMPIOS option to specify the number of batches to save in the snapshot directory during simulation.
Assume you have an application named app.py:
$ VAISW_SNAPSHOT_DUMPIOS=5 VAISW_SNAPSHOT_DIRECTORY=snapshot python3 app.py
After this command finishes, the snapshot directory contains directories named ‘inputs’ and ‘outputs.’ These directories include the inputs used for the simulation and the results of the simulation, respectively, saved as NumPy .npz files.
On-board Step
Use the vart_ml_runner python application, which is a generic snapshot runner, to run and compare outputs on the board.
Perform these steps on the board:
Source the Vitis AI tools environment:
$ source /etc/vai.sh
Execute the
vart_ml_runner.pyapplication with the –real_data flag:$ vart_ml_runner.py --snapshot <path_to_snapshot> --real_data
The application processes each input to perform an inference, then compares the output with the simulation results stored in the snapshot.
If the simulation and the actual run match, it prints OK: no error found, or ERROR: found mismatch with gold if a discrepancy is found.
Q2: How to debug/fix issues with model deployment on the target board?#
Ans: Sometimes you might encounter the following common issues during model deployment on the target board:
One CPU core is available on power-up: After a Power-OFF/ON cycle, you see only one CPU core available. Ideally, both CPU cores should be available after Linux boots. This is a known issue and will be addressed in the next release.
Freezing of the AIE: This might occur if there is a bug in the snapshot generation or a bug in the AIE code.
The fix for these two issues is to reboot the board.
Q3: How to fix timestamp error observed at runtime on the target board?#
Ans: You might encounter the following sample timestamp error on the target board:
Timestamp error: the snapshot was generated using 0xYYYYYYYY but we found 0xZZZZZZZZ at SRVBus offset 0x000000000000 in the FPGA.
In this case, ensure that the snapshot-generated bitstream timestamp matches the example design bitstream timestamp.
Q4: How to debug issues with x_plus_ml_app?#
Ans: The VART interface and x_plus_ml_app offer extensive debugging features to help you identify and resolve errors. You can enable or disable debugging with command-line options or environment variables at different levels of the framework, giving flexible and controlled debugging.
Command Line Debugging in ``x_plus_ml_app``
Activate or deactivate application-level debugging by specifying the -l option for x_plus_ml_app at runtime. This provides granular control of log levels for specific application runs. Each level includes logs at that level and all lower levels.
The available log levels are:
1: ERROR 2: WARNING 3: INFERENCE RESULT 4: FIXME 5: INFO 6: DEBUG
Example command with log level:
$ x_plus_ml_app -i <path_to_test_jpeg_image> -c /etc/vai/json-config/yolov5_pl.json -s <path_to_snapshot> -l 6
Framework-Level Debugging with VART and VVAS CORE
For more detailed debugging of framework-level processes, enable logs within the VART and VVAS CORE interfaces. This is useful for understanding internal flow and pinpointing deeper issues.
Enabling VART Logs Set the following environment variables before launching the application:
$ export VART_LOG_FILE_PATH=CONSOLE
$ export VART_CORE_DEBUG_ENV=5
This displays VART logs on the console at DEBUG level.
Enabling VVAS CORE Logs To enable logs for the VVAS CORE framework, set these environment variables:
$ export VVAS_CORE_LOG_FILE_PATH=CONSOLE
$ export VVAS_CORE_DEBUG=4  # 4 is for INFO level verbosity
Adjust the VVAS_CORE_DEBUG level to control verbosity:
0: NONE 1: ERROR 2: WARNING 3: FIXME 4: INFO 5: DEBUG
Logs print on the console and offer detailed insights into the VVAS CORE framework.
Redirecting VART and VVAS Logs to a File
Besides displaying logs on the console, you can redirect VART and VVAS CORE logs to a file for easier analysis and persistent logging. Set specific environment variables to a file path to achieve this.
Example:
To save VART logs to a file, specify the VART_CORE_LOG_FILE_PATH environment variable:
$ export VART_CORE_LOG_FILE_PATH=/tmp/vart_logs.txt
$ export VART_CORE_DEBUG_ENV=5
This configuration writes all VART logs at the specified log level (and below) to /tmp/vart_logs.txt.
Use these features to effectively debug and optimize your applications with the VART interface and x_plus_ml_app.
Q5: How to debug build issues with Vitis AI Reference Design?#
Ans: You might encounter the following issues with building the Vitis AI Reference Design.
Design Failed to Meet Timing
Check these logs for more information:
1. Vitis-AI/examples/reference_design/vek280/vitis_prj/link/_x/link/vivado/vpl/runme.log
2. Vitis-AI/examples/reference_design/vek280/vitis_prj/link/_x/link/vivado/vpl/prj/prj.runs/impl_1/bd_wrapper_timing_summary_routed.rpt
get_timing_paths: No valid object(s) found
For further debugging, check:
Vitis-AI/examples/reference_design/vek280/vitis_prj/link/system_performance.cfg
and
Vitis-AI/examples/reference_design/vek280/vitis_prj/link/constraints/post_* files.
Resolution: Confirm that the specified objects exist in the current design. If they do, ensure that the correct design hierarchy is specified for the object.
Q6: How to debug inference time-out issue while running model on target board ?#
Ans: There could be different mistakes during the IP integration that could lead to an inference timeout.
Either the NPU IP is not properly connected to the NOC
The reserved memory of the NPU IP is not reserved for Linux and Linux is writing in this area
Reserved memory section of
the device tree (examples/reference_design/te0950/te0950_platform/sw/vart_ml_perf.dtsi in the Trenz example design)
and address in the block design should match.
The interrupt is not properly connected.
The clocks are not running.
To debug the issue, following experiments are suggested:
Reboot the board (this is required to put back the NPU IP in a correct state)
Enable VAI environment: * . /etc/vai.sh
Measure the clocks * vartml_tools tester * Output should be something like:
Architecture: AIEML_V1C
FPGA family: VERSAL
Timestamp: 0x7a7e01df
No assertion was raised.
MMCM: 0x0.
Clock 100MHz frequency: 100.00 MHz.
Clock 4x     frequency: 381.38 MHz.
Sanity test: OK
Control bus memory: OK
Not testing DDR, use tester --test-ddr if needed.
Try the inference without the interrupt (so using polling)
VAISW_POLLING_ENABLE=true vart_ml_runner.py --snapshot /run/…
If it still reports a timeout, you can share with us (vitis_ai@amd.com) the output of the following commands, this will help making sure the DDR reserved memory are matching:
dmesg | grep -i ‘reserved mem’ xrt-smi examine -r dynamic-regions xrt-smi examine -r memory
Debug an Application on the Remote Target with VS Code IDE
Remote debugging means launching the Code GUI from the host PC while the Python application runs on the target board.
1 Setup#
Make sure to have installed on the remote VEK280 board the debugpy package using the following command (launched directly from a UART terminal connected to the target board):
python3 -m pip install debugpy
From your Microsoft Visual Studio (VS) Code IDE running on the host PC, add these extensions for remote debugging:
Remote-SSH
Remote-SSH: Editing Configuration Files
Remote-Tunnels
Remote-Development
Remote-Explorer
Then click the Remote Explorer icon (on the left column) to remotely connect to the VEK280 target board, depending on its IP address (typically something like 192.168.1.58), with account root and password root.
Now add some extensions for Python:
Python
Pylance
Python-Debugger
See the following Settings of MS Code Studio SSH remotely connected to VEK280 board image for further details on the Extensions.
For C++ debugging, you add the C/C++ IntelliSense, debugging, and code browsing package.
2 Prepare JSON File#
Create the launch.json file for debugging a Python file that runs on the remote target board via SSH. In your workspace, set the correct folder opened in the IDE (“cwd”: “${workspaceFolder}”), as shown here in the following source code:
{
    "version": "0.2.0",
    "configurations": [

        {
            "name": "Python: Remote Debug",
            "type": "python",
            "request": "launch",
            "mode": "remote",
            "cwd": "${workspaceFolder}",
            "program": "${file}",  // Change this to your script
            "console": "integratedTerminal",
            "justMyCode": false,
            "env": {
                // Your environment variables here
                "VAISW_INSTALL_DIR" : "/etc/vai",
                "RESNET50_SNAPSHOT" : "/run/media/mmcblk0p1/snapshot.VE2802_NPU_IP_O0_A304_M3.resnet50.TF",
                "PYTHONPATH" : "/etc/vai/lib/python"
            },
            "args": [
                "--mode", "inf",
                //"--mode", "post",
                "--snapshot",   "/home/root/snapshots/snapshot.bs1.coco_yolov5s",
                //"--image_path", "/home/root/demo/yolov5/data/images/bus.jpg",
                "--images_dir", "/home/root/demo/yolov5/data/images",
               //"--pred_data",  "/tmp/yolov5_output0_0.raw",
               "--json",  "target_bus_zidane_coco_detections.json"
               //"--json",  "target_coco_10images_detections.json"
            ],
            "port": 5678,  // Change to your debug port
            "host": "localhost",  // If running on the same server
            "timeout": 300  // Timeout in seconds
        }
    ]
}
It is very important at which folder level you place the .vscode/launch.json file. For example, in some cases it is placed directly in the /home/root folder of the target board file system, which is also the folder opened directly in the GUI, as show in the following Settings of MS Code Studio SSH remotely connected to VEK280 board image.
For C++ debugging, use a code fragment similar to the following in the same launch.json file:
{
    "name": "Debug C++",
    "type": "cppdbg",
    "request": "launch",
    "program": "${workspaceFolder}/Vitis-AI/src/vart_ml/demo/test_yolov5s",
    "args": [
              "--snapshot",   "/home/root/YOLOv5s/snapshots/snapshot.bs1.coco_100Q_yolov5s",
              "--imgPath", "/home/root/datasets/vehicles_open_image/valid/images",
              //"--imgPath"   , "/home/root/datasets/imagenet/ILSVRC2012_img_val" ,
              //"--labels", "/etc/vai/labels/labels",
              "--nbImages"  , "3",
              //"--batchSize" , "1",
              "--dataFormat", "native"
           ],
    "stopAtEntry": false,
    "cwd": "${workspaceFolder}",
    "environment": [
        {
            "name": "VAISW_INSTALL_DIR",
            "value": "/etc/vai"
        },
        {
            "name": "PYTHONPATH",
            "value": "/etc/vai/lib/python"
        }
    ],
    "externalConsole": false,
    "MIMode": "gdb",
    "setupCommands": [
        {
            "description": "Enable pretty-printing for gdb",
            "text": "-enable-pretty-printing",
            "ignoreFailures": true
        }
    ],
    //"preLaunchTask": "build" // Reference to the build task
    "miDebuggerPath": "/usr/bin/gdb", // path to gdb
    //"miDebuggerArgs": "",
    "stopAtConnect": true
    //"remote": true
}
3 Effective Debug#
Python#
Now you are ready to debug your Python application.
Click the Run and Debug (CTRL+SHIFT+D) icon on the left column, then click the green button, which starts Python Remote Debug (F5). You see something similar to the Settings of MS Code Studio SSH remotely connected to VEK280 board image.
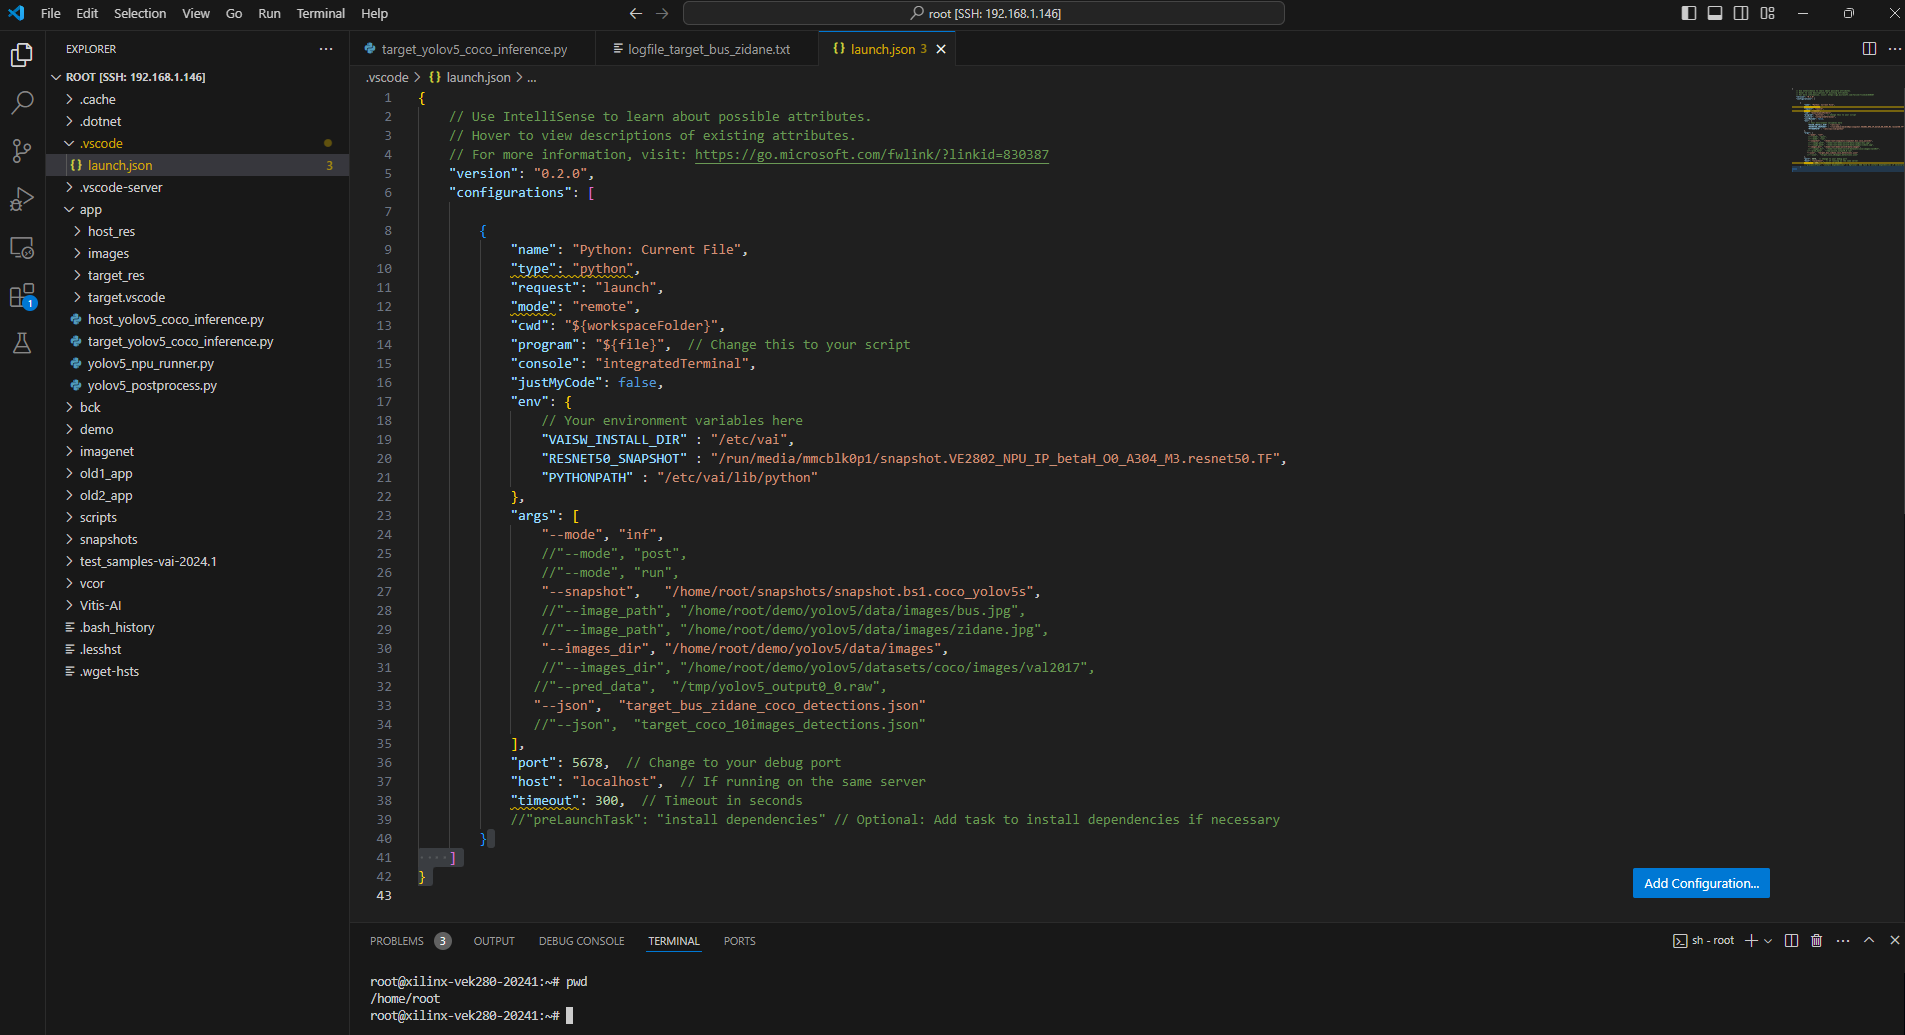
Settings of MS Code Studio SSH remotely connected to VEK280 board.
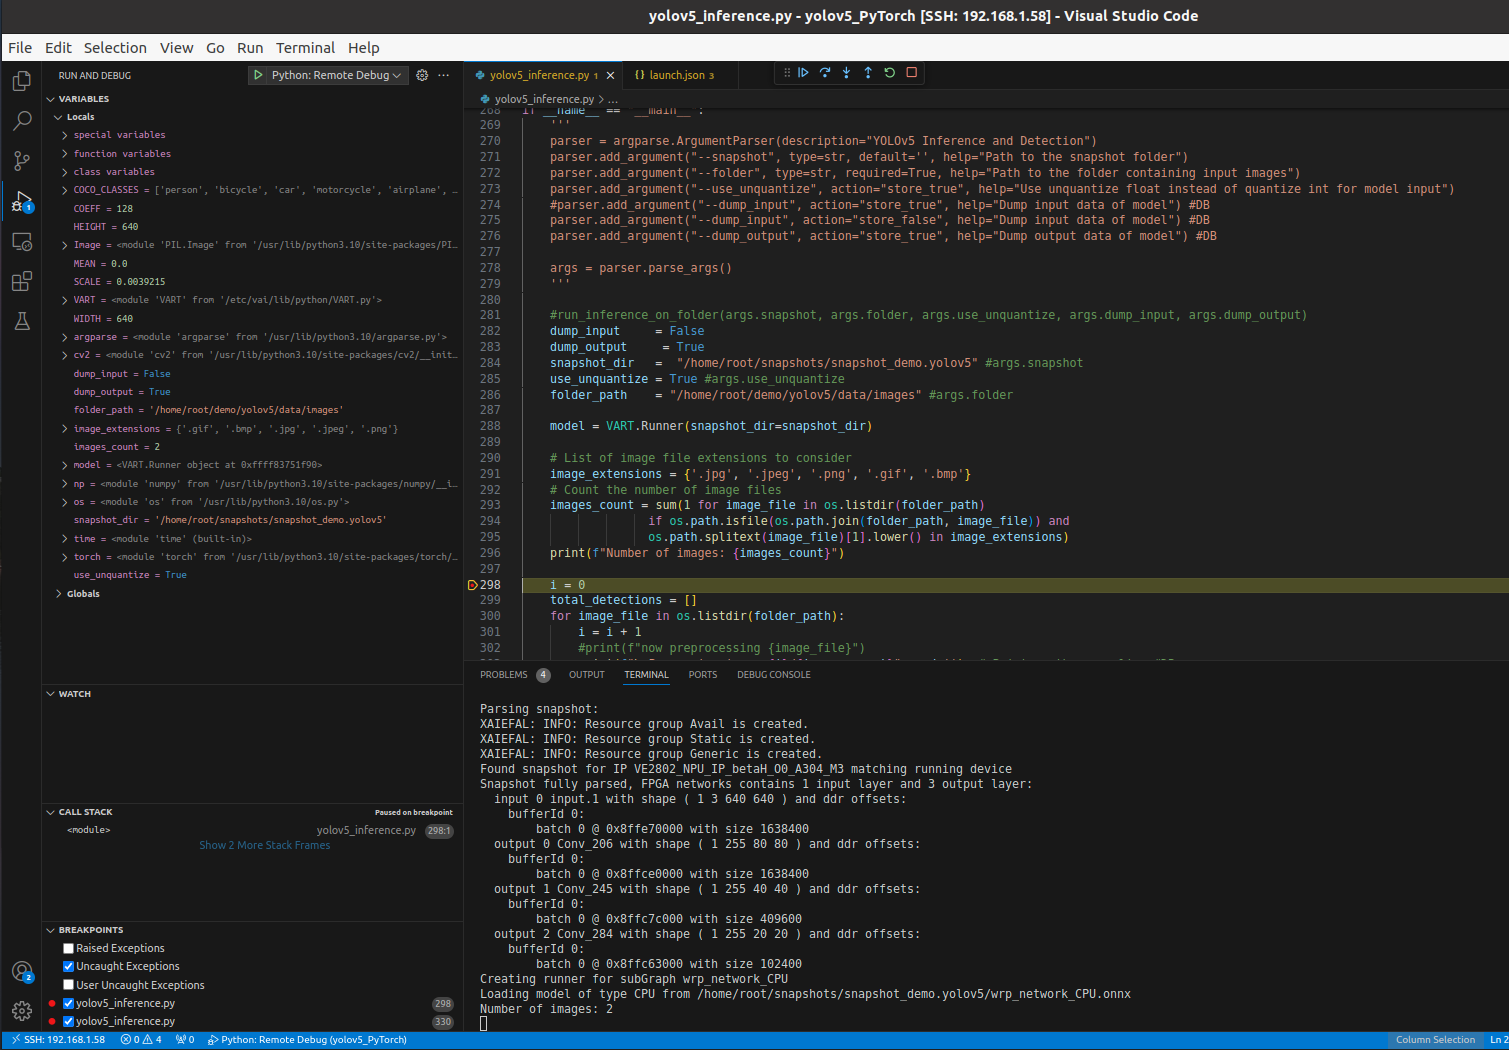
Debug a Python file on the VEK280 board via VS Code IDE.
C++#
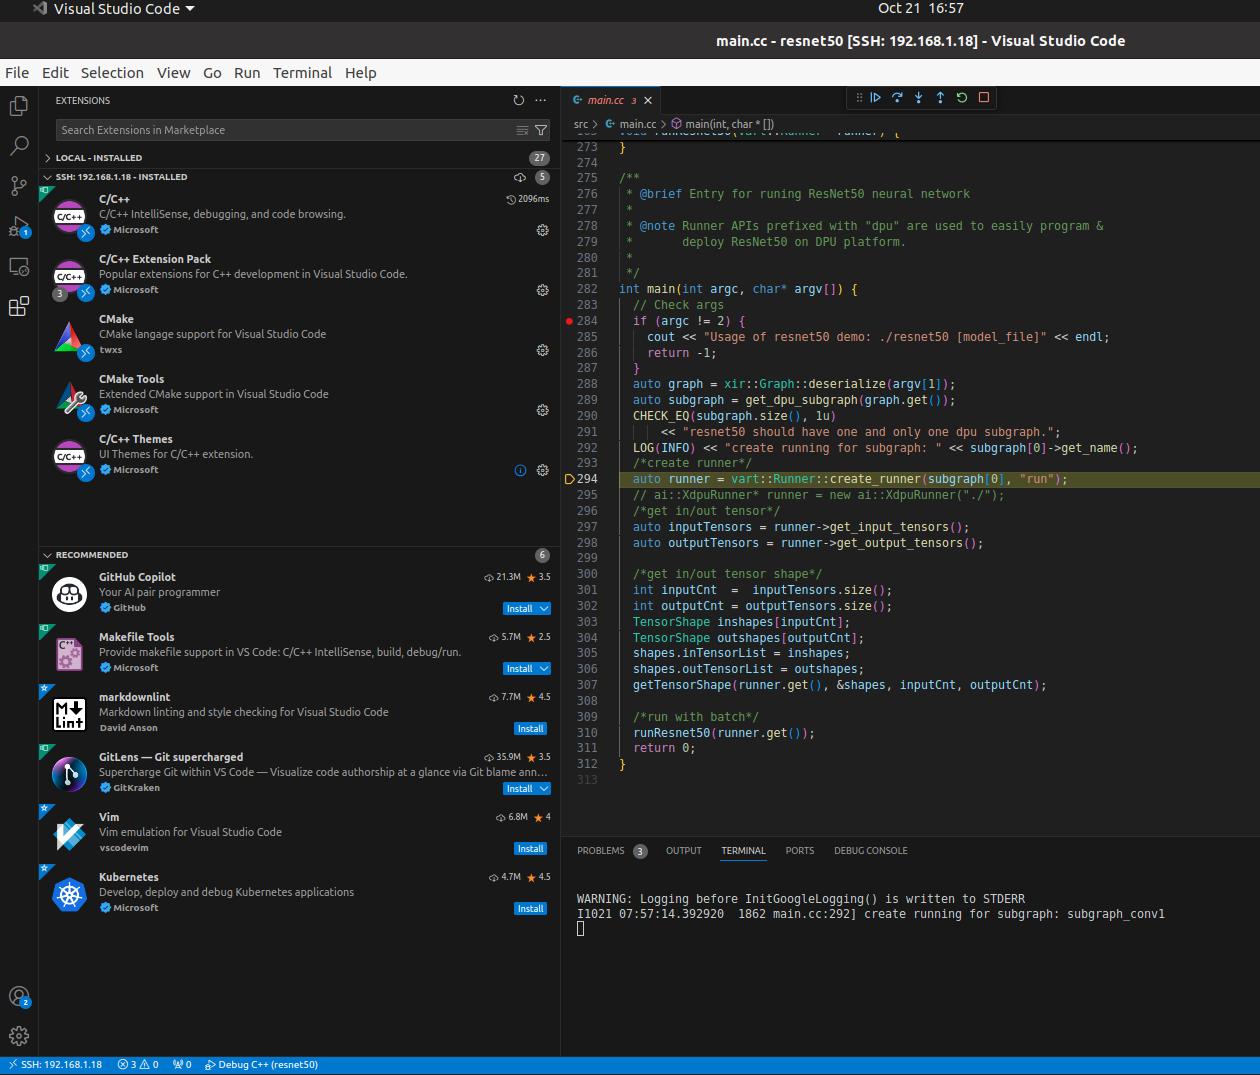
The same process applies to debugging C++ files, with the only difference that it is typically slower. It takes a while for the debugger to load all the .so libraries of the executable under debugging, as shown in the following Image.
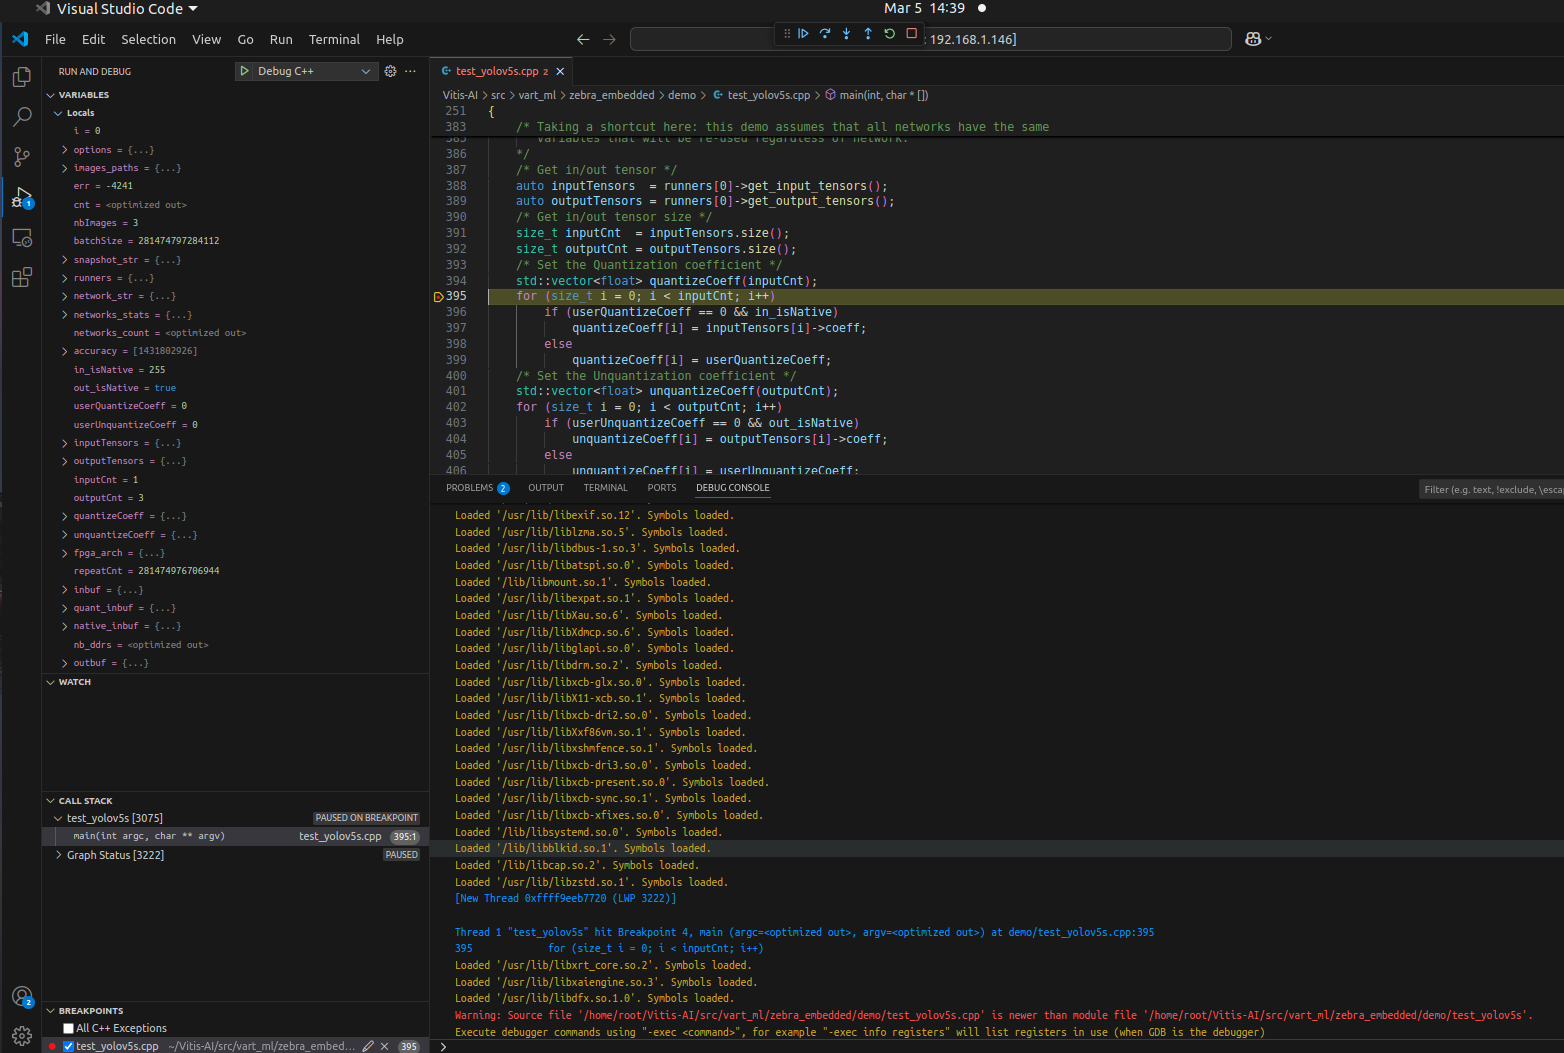
After that process (check the DEBUG CONSOLE window in the GUI) finishes, you can set breakpoints and see variables (on the left panel) and output text messages (on the TERMINAL window in the GUI), as illustrated in the Step-by-step debugging the C++ application Image.
Loading the .so libraries after C++ debugging start.
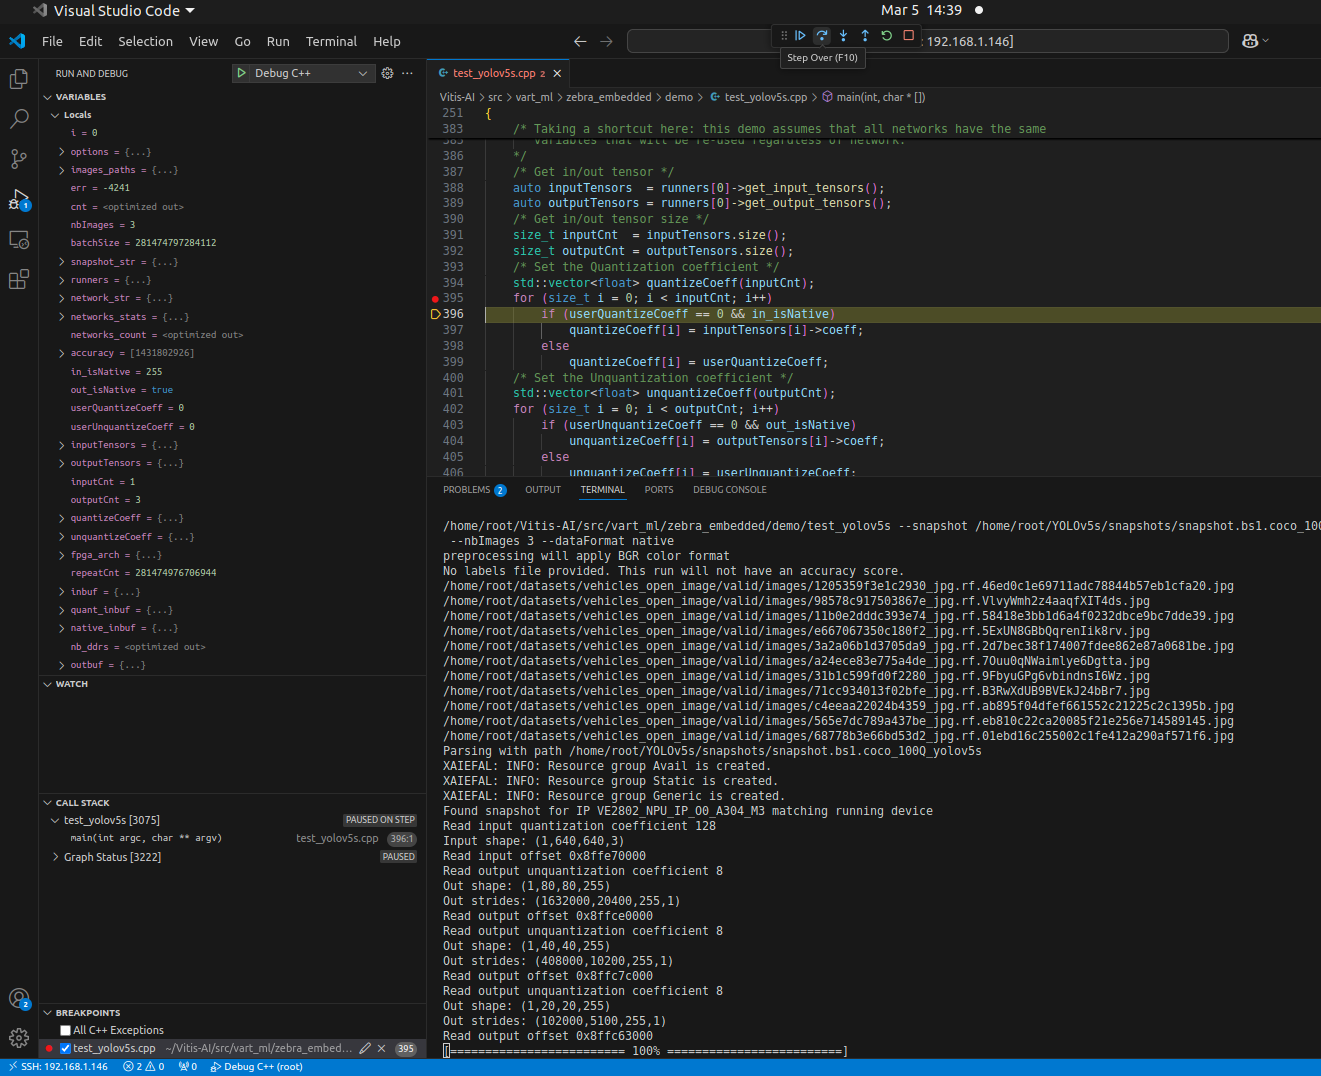
Step-by-step debugging the C++ application.