Performance#
Use this section to review model performance across one or more inference runs. It contains two pages: Summary and Timeline.
Summary#
The Performance Summary page presents overall inference statistics, along with charts that break down runtime by operator. When ONNX Runtime profiling is enabled, the total inference time (including layers executed on the CPU) is displayed. When NPU profiling is enabled with the ai_analyzer_profiling flag, additional NPU-specific metrics are shown, including GOP and MAC efficiency, as well as a chart of runtime by NPU operator type.
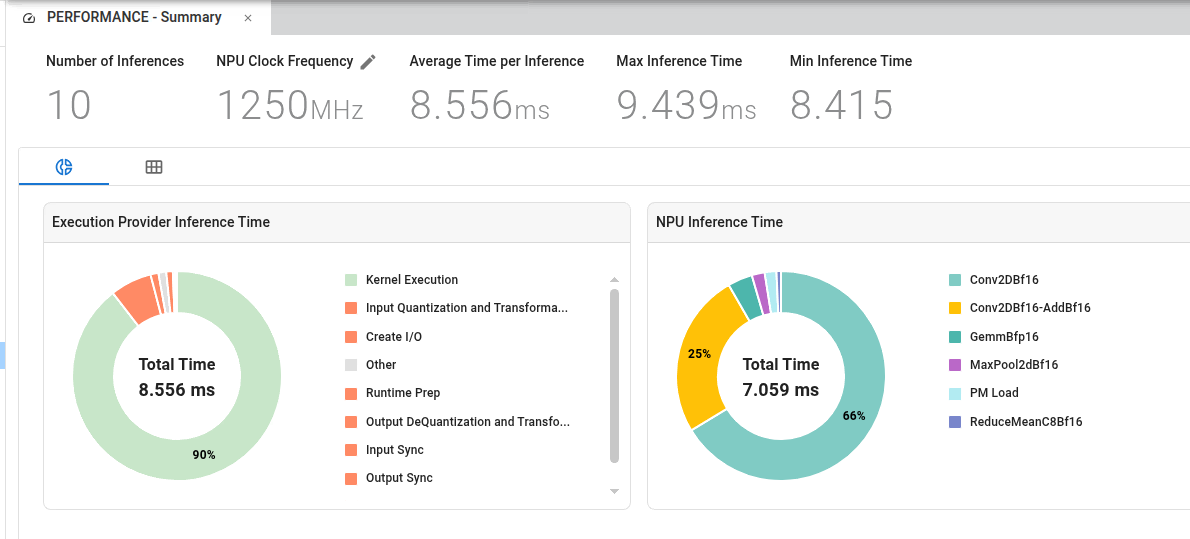
At the top of the page, a summary of model performance characteristics is displayed, including:
Number of inferences: The total number of inferences on which all reported statistics are based.
Clock Frequency: Displays the assumed NPU clock frequency. This value is editable. When it is changed, all timestamp data (collected in clock cycles but displayed in time units) is recalculated accordingly.
Average Time per Inference: Calculated by dividing total execution time by the number of inferences. This metric provides an overall view of model performance across multiple runs.
Max/Min Inference Time: Displays the maximum and minimum inference times observed across all runs to highlight performance variability. These values can help identify outliers or bottlenecks in specific runs.
Performance Characteristics
NPU Inference Time
NPU inference time is generally consistent across inference operations, indicating stable accelerator-side performance.
Execution Provider Inference Time
Execution Provider inference time can vary significantly between initial and subsequent inference operations due to the following factors:
Initialization Overhead: The first several inference operations include one-time initialization costs, which are reflected in measured inference time.
Steady-State Performance: After initialization completes, these overhead costs are removed, resulting in improved performance for subsequent inferences.
Impact on Average Performance
The impact of initialization overhead on reported average performance depends on the total number of inference operations:
Large Sample Sizes: For workloads with many inferences, initialization overhead has minimal impact on overall average performance.
Small Sample Sizes: For workloads with few inferences, initialization overhead can significantly skew average performance metrics.
Note: When evaluating performance, consider the number of inference operations in your workload to interpret reported averages accurately.
Timeline#
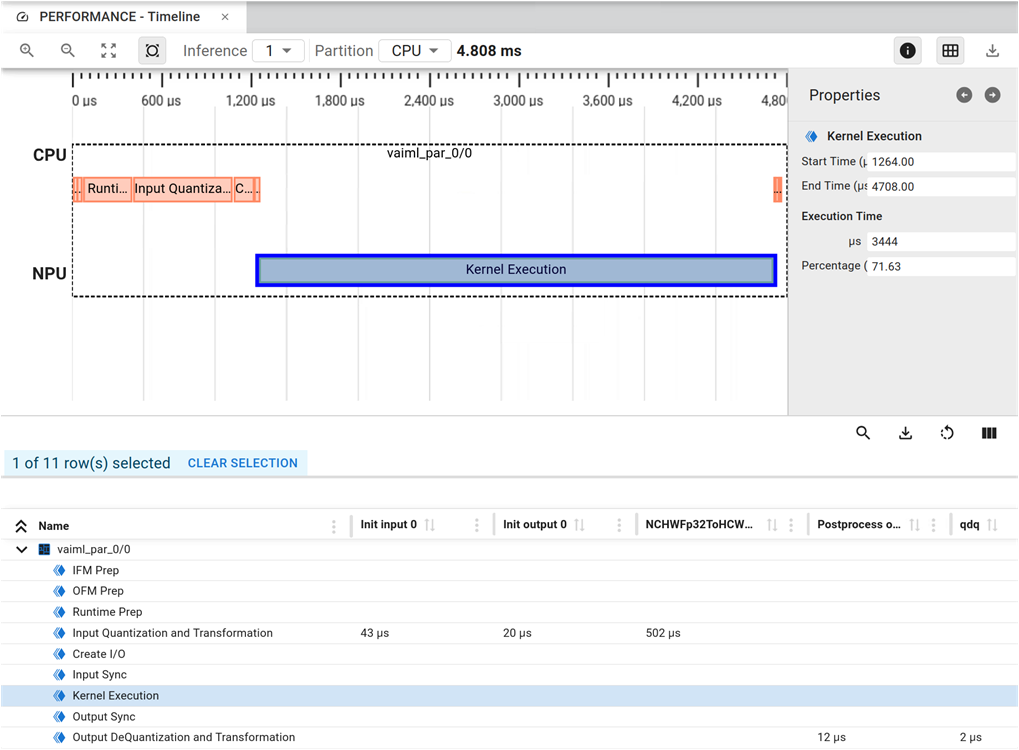
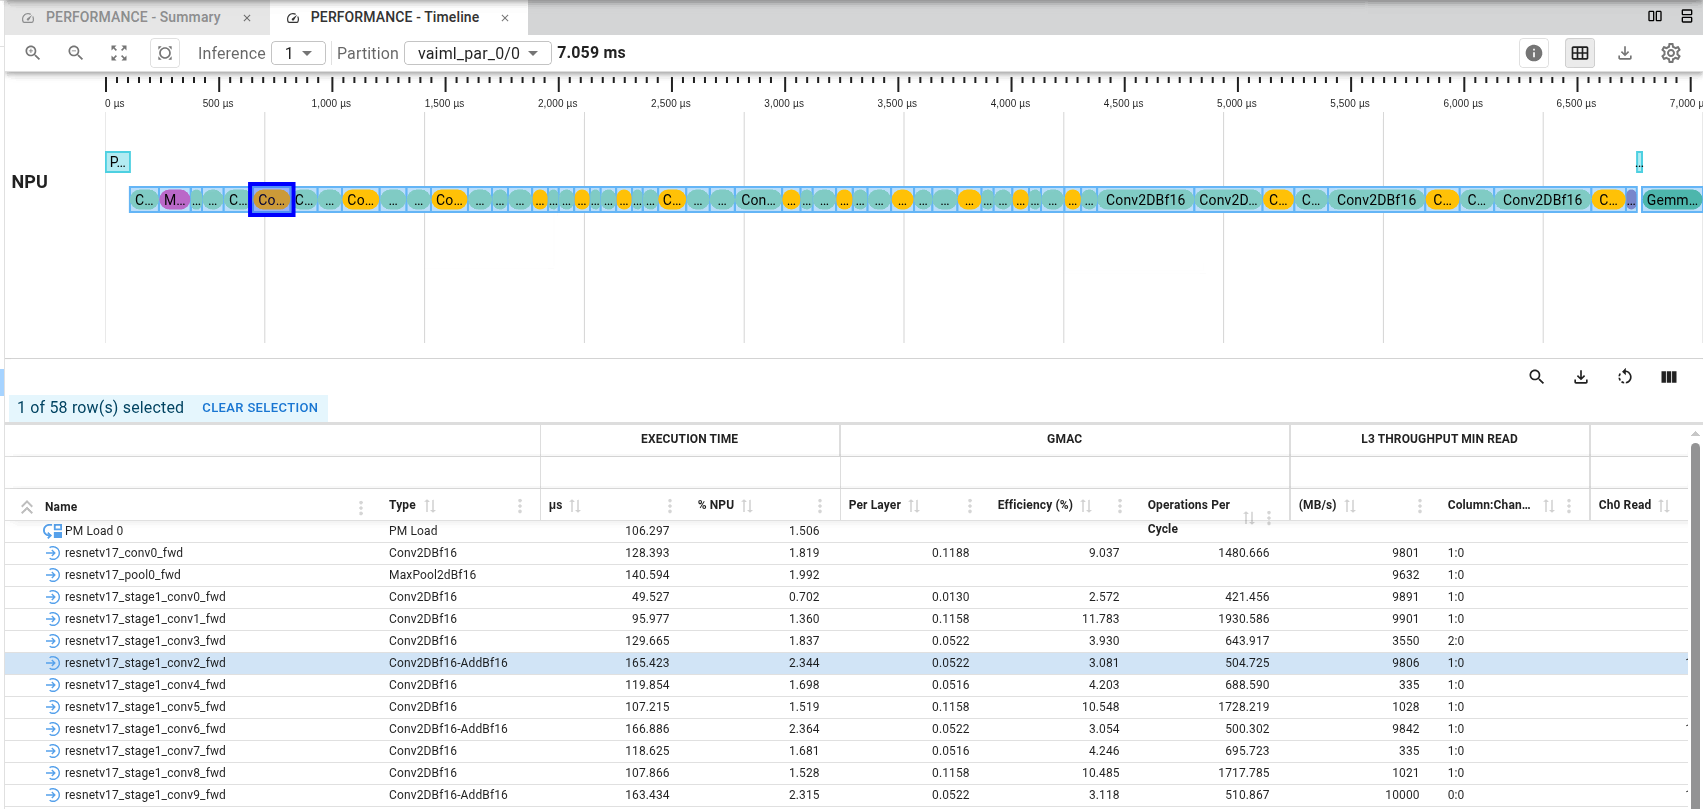
The Performance Timeline provides a layer-by-layer view of model execution. The upper section presents a graphical timeline of layer execution, while the lower section displays the same data in tabular form. The Timeline page shows one inference at a time. If profiling data is available for multiple inferences, use the Inferences chooser to select which inference to display.
Within each inference, use the Partition chooser to view either overall model execution or detailed NPU execution data.
If you select the CPU partition, the view appears as in the following figure:
If you select the NPU view (vaiml_par_0/0), the timeline shows execution of each layer on the NPU, with each layer represented as a horizontal bar. Bar length corresponds to layer execution time, and bar position indicates when the layer executed during inference. This view enables visual analysis of per-layer performance:
Toolbar#
Show or hide the properties panel for selected objects using the Show Properties toggle.
Show or hide the table under the timeline using the Show Table toggle.
Export the graphical timeline as SVG using Export to SVG.
In the
vaimlpartition view, an additional control is available to change display units (cycles or time) and clock frequency (GHz) used for timeline data.
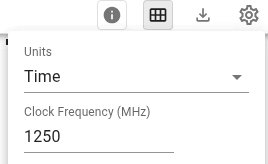
Table Toolbar#
Show or hide the search area using Show/Hide Search. Use this to locate specific layers in the table.
Save the table in CSV format using Export to CSV.
Use Show/Hide Columns to select which columns are displayed.
Use Reset Settings to restore default column display settings.
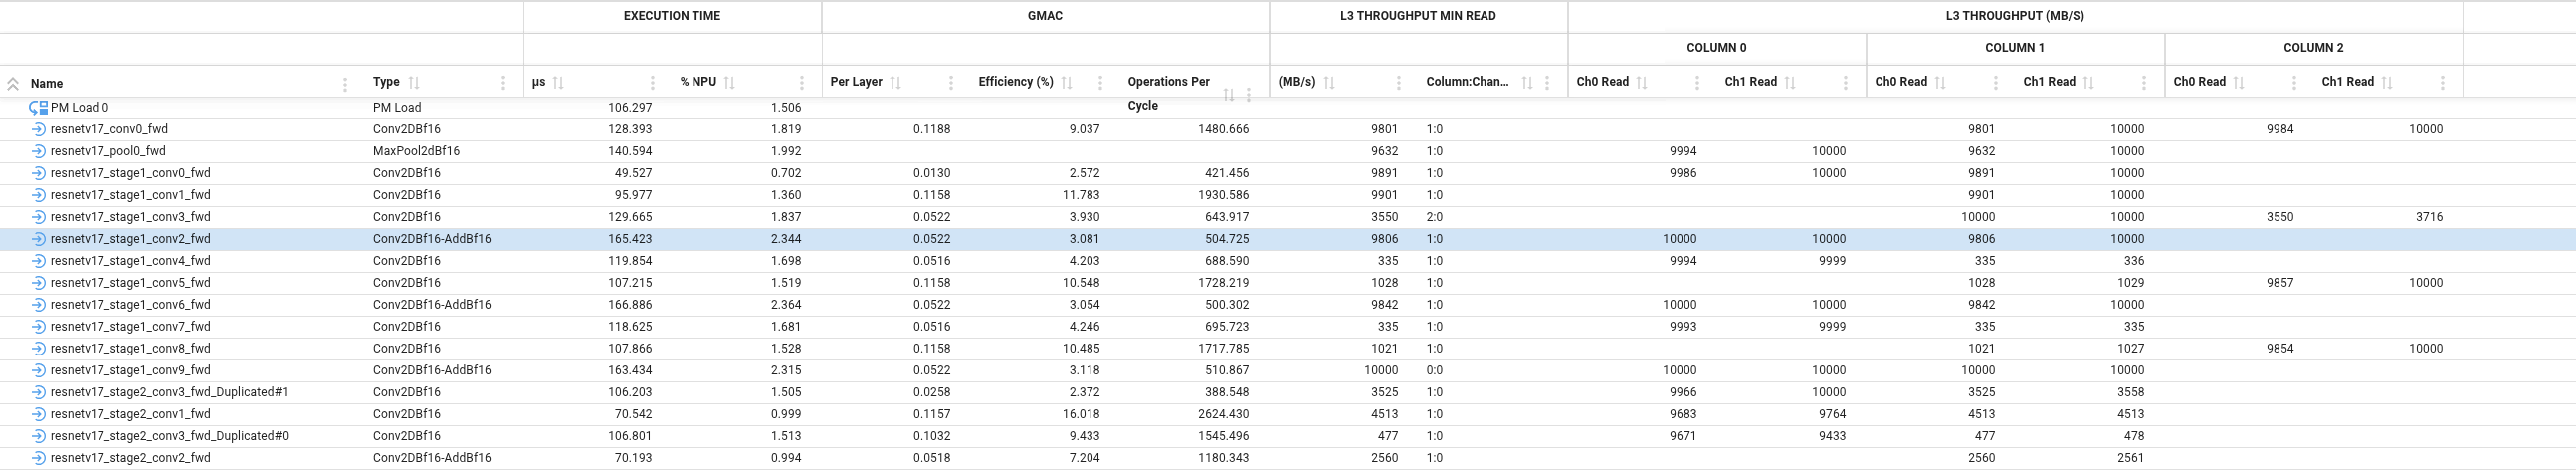
Table Columns#
The table columns are grouped into generic and specific categories to provide comprehensive insight into model execution and compute performance.
- Generic columns: General information about model layers and their characteristics.
“Comment”: Displays an annotation comment for the model layer, if present.
“Start/End Time (µs)” and “Start/End Cycle”: Provide basic layer execution timing information.
“µC Variability (%)”: Provides temporal metrics for models processing variable-size input samples. This metric quantifies the time difference between completion of the first sample inference and completion of the final sample inference in the same input sample set, as observed by the micro-controllers. High variability might indicate routing inefficiencies or memory spilling.
- Execution Time columns: Layer execution-time metrics during inference.
“µs” and “Cycles”: Execution time of the layer for the selected inference.
“% NPU” and “% Total”: Ratio of layer execution time to NPU execution time or total inference execution time.
“Average”, “Min”, “Max” (cycles or µs): Execution time statistics across all inferences.
- Compute Performance (GMAC) columns: Compute requirements and efficiency metrics.
“Per Layer”: Compute requirement for each layer, in GMAC.
“Efficiency (%)”: Computational efficiency of the layer.
“Operations Per Cycle”: Number of operations performed per cycle.
The following options are only displayed when enhanced profiling data is enabled, as described in DDR Throughput Profiling:
- L3 Throughput Min Read (MB/s) or L3 Throughput Min Write (MB/s) columns: Data-transfer performance for each layer. These columns report the minimum observed throughput, indicating the layer that might be experiencing a memory-access bottleneck. A value significantly below 10 GB/s (for a 1.25 GHz AI Engine array clock) might indicate memory-access bottlenecks.
“MB/s”: Minimum observed throughput for the layer, in MB/s.